II.3. Spectra of various light sources
A spectrum generally describes the variation of a certain physical quantity as a function of wavelength. The term "spectrum" without any further specifications refers to the quantification of the monochromatic intensity as a function of wavelength (the term "spectrum" is also used for other (physical) quantities apart of intensity, but is then always used with a specific prefix. As an example, the strength of a biological reaction (for example erythema — see § VI.1) to light with different wavelengths is described by an "action spectrum"). As an example, the next figure shows spectra of an incandescent bulb, natural sunlight and two types of discharge lamps.
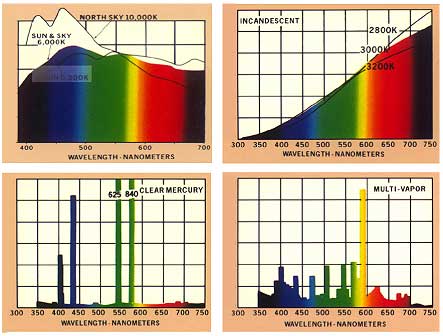
Fig. II.5. Emission spectra of natural light from the sun and the sky and of artificial light from incandescent bulbs at different temperatures, from a mercury vapour lamp and from a multi-vapour lamp.
When examining spectral intensity distributions of various light sources, it is possible to distinguish four significant types. These are:
- Monochromatic radiation
- Near monochromatic radiation
- Continuous spectra
- Band spectra
Typical sources of monochromatic radiation are lasers and the output signal from monochromators with narrow bandwidths. Typical sources of near monochromatic radiation are light emitting diodes and band pass filtered sources.
If a mixture of radiation covers a relatively large range of wavelengths without gaps, this radiation has a continuous spectrum. Typical examples of continuous radiation spectra are direct and diffuse sunlight and light emitted by incandescent bulbs. On the other hand, in a band spectrum there are gaps separating individual regions of radiation. If a spectrum has a number of lines of monochromatic intensity, it is called a line spectrum. Typical sources emitting a line spectrum are gaseous discharge lamps, such as helium or xenon lamps, and metal vapour lamps, such as the mercury vapour lamp. Multi-vapour discharge lamps are used to achieve a more uniform spectral distribution (see Fig. II.5.).
Tutorials

Copyright © 2008 - 2025 Gigahertz-Optik, Inc. All Rights Reserved